L'outil de gestion des programmes immobiliers (GPI) facilite la vente et l'achat de terrains en centralisant toutes les informations, de la superficie des terrains à la construction des lots. Cette solution permet une gestion efficace des projets immobiliers, offrant une vue d'ensemble complète pour des décisions éclairées.
#User Interface
#User Experience
#Prototyping
#Illustration
#Design System
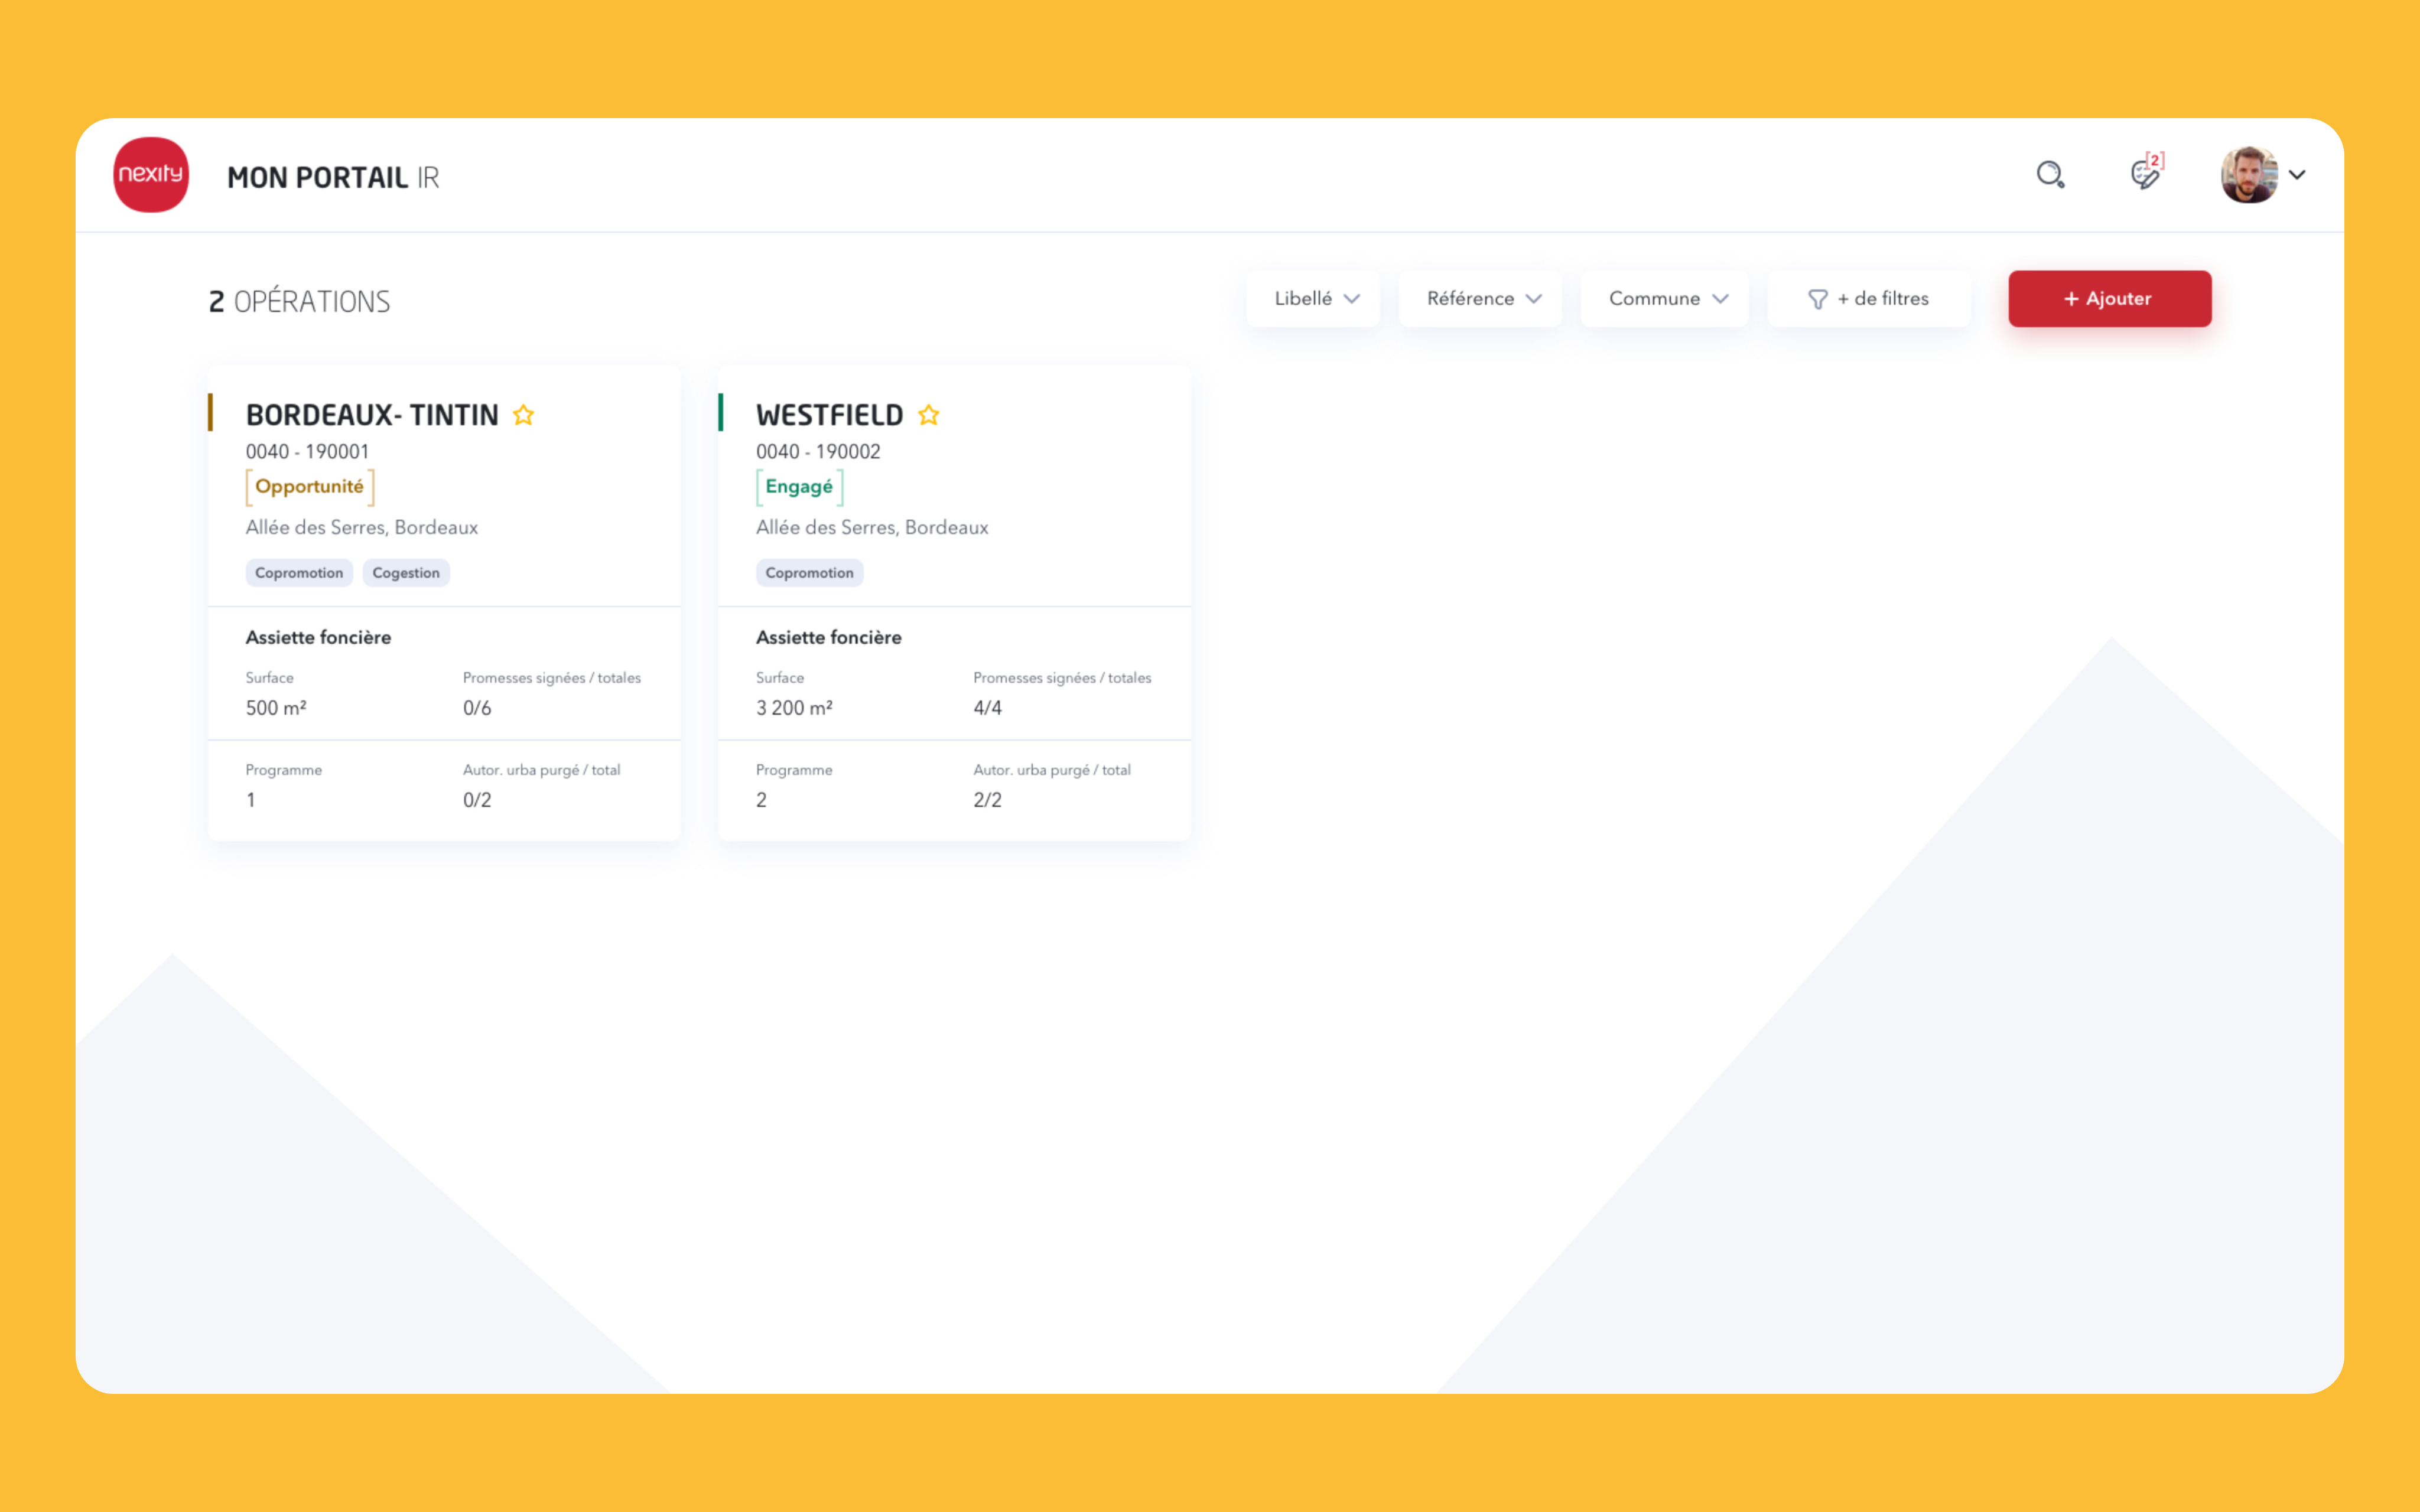
GPI, Page d'accueil
Un travail a été entrepris pour améliorer les conditions de travail et centraliser les informations sur un même outil. Les outils existants ne satisfaisaient pas les utilisateurs en raison d'une interface lourde et inadaptée. Les collaborateurs de Nexity ont donc recours à Excel comme solution temporaire, mais cela complique le partage et le recensement des données, rendant la gestion inefficace.
Dashboard
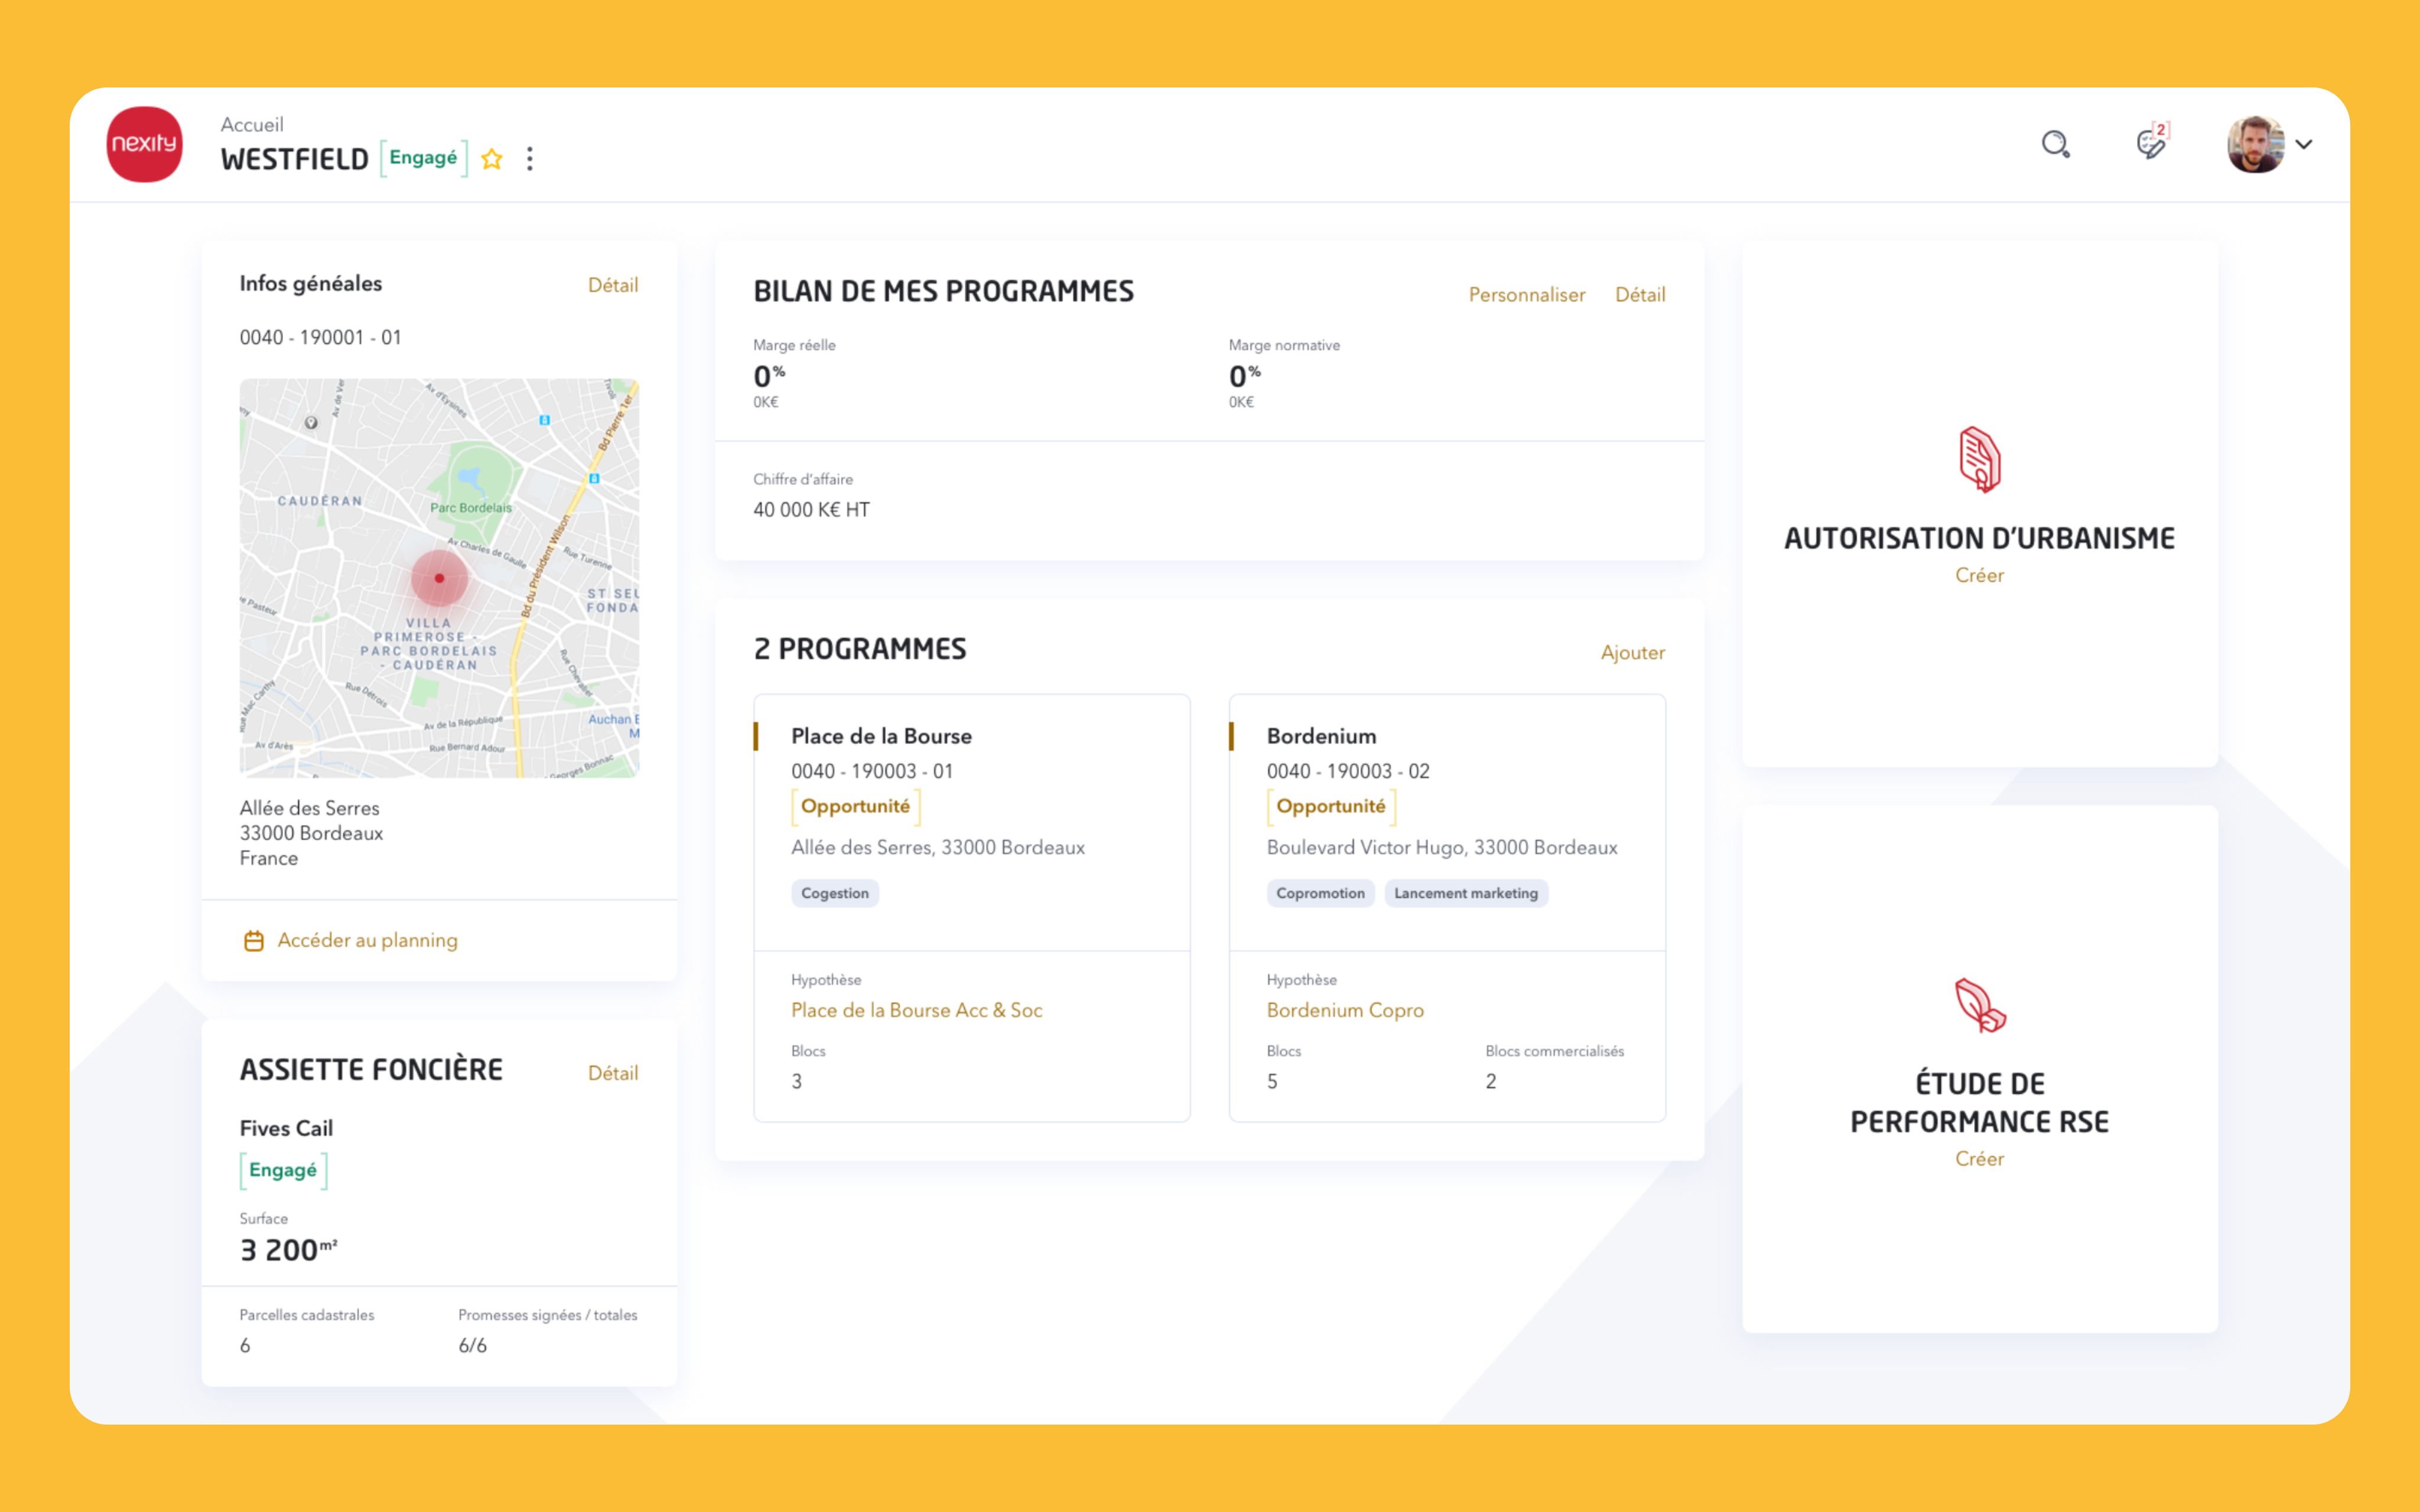
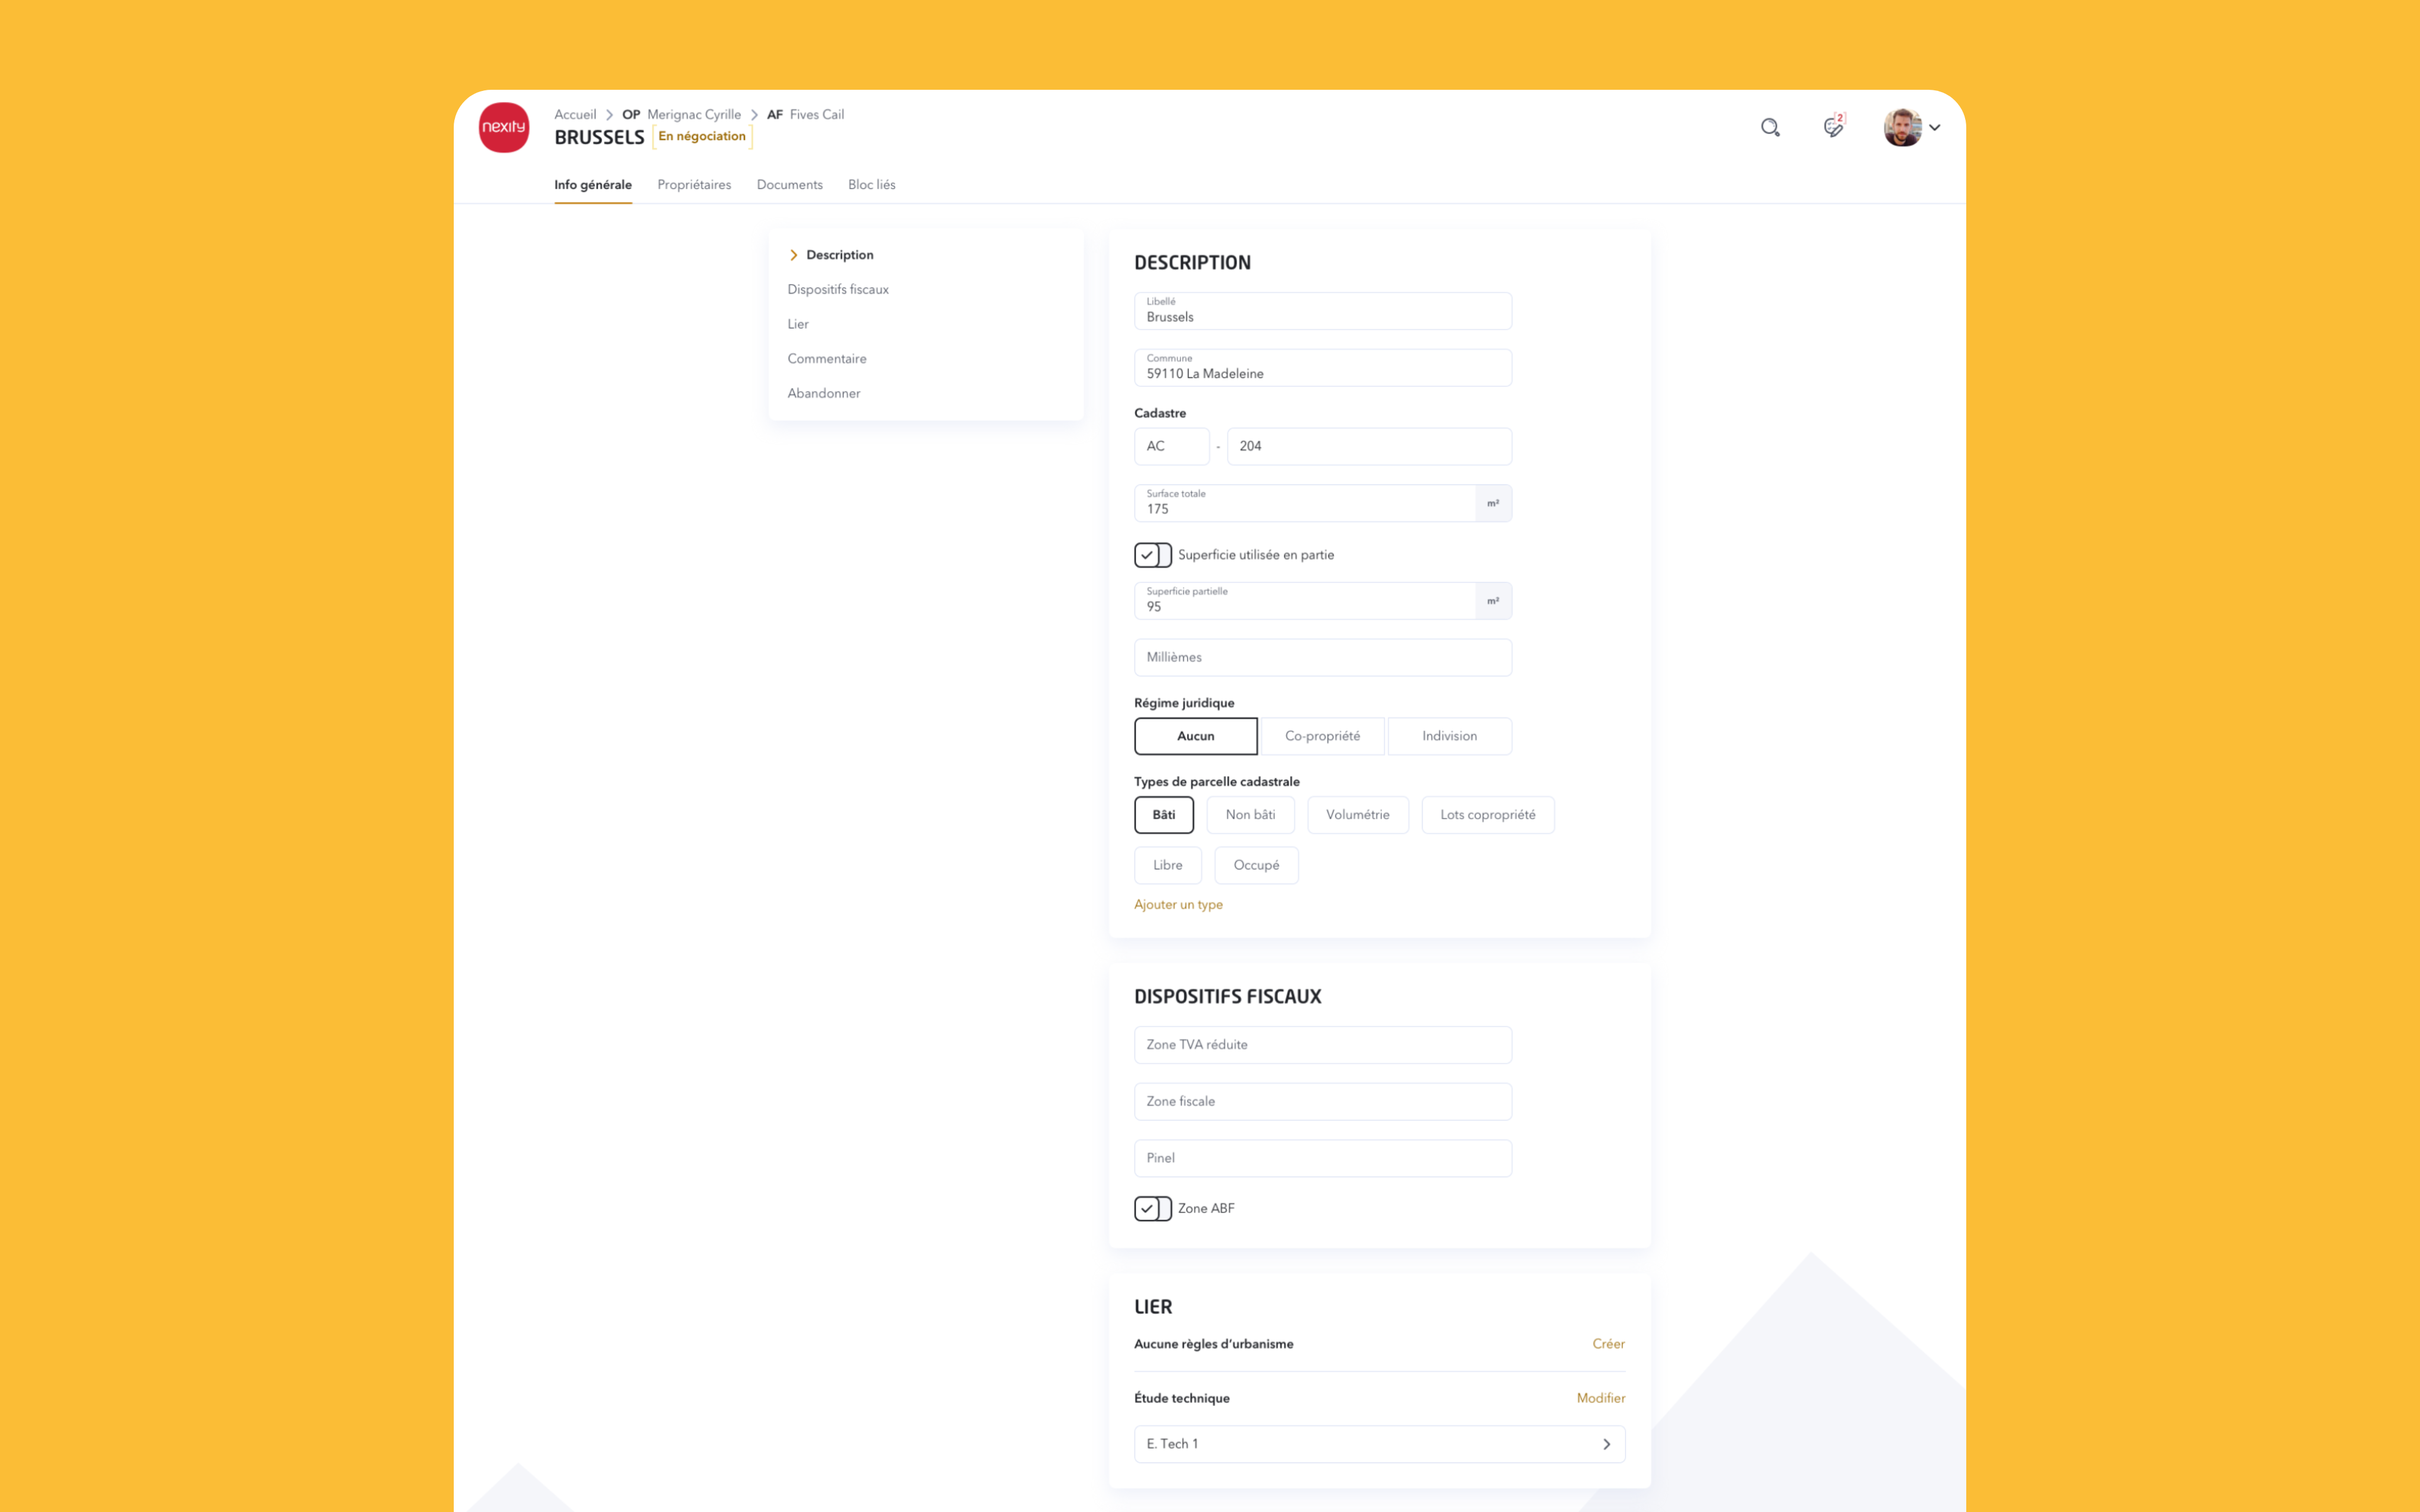
Le dashboard regroupe toutes les informations pertinentes pour l'utilisateur, affichant l'adresse de l'opération, les chiffres liés au bilan, le nombre de programmes et les données de l'assiette foncière. Sa mise en page met en avant les informations clés, notamment le bilan et le nombre de programmes associés, facilitant ainsi une prise de décision rapide et éclairée.
Dashboard, Présentation de toutes les informations du terrains
UI Kit
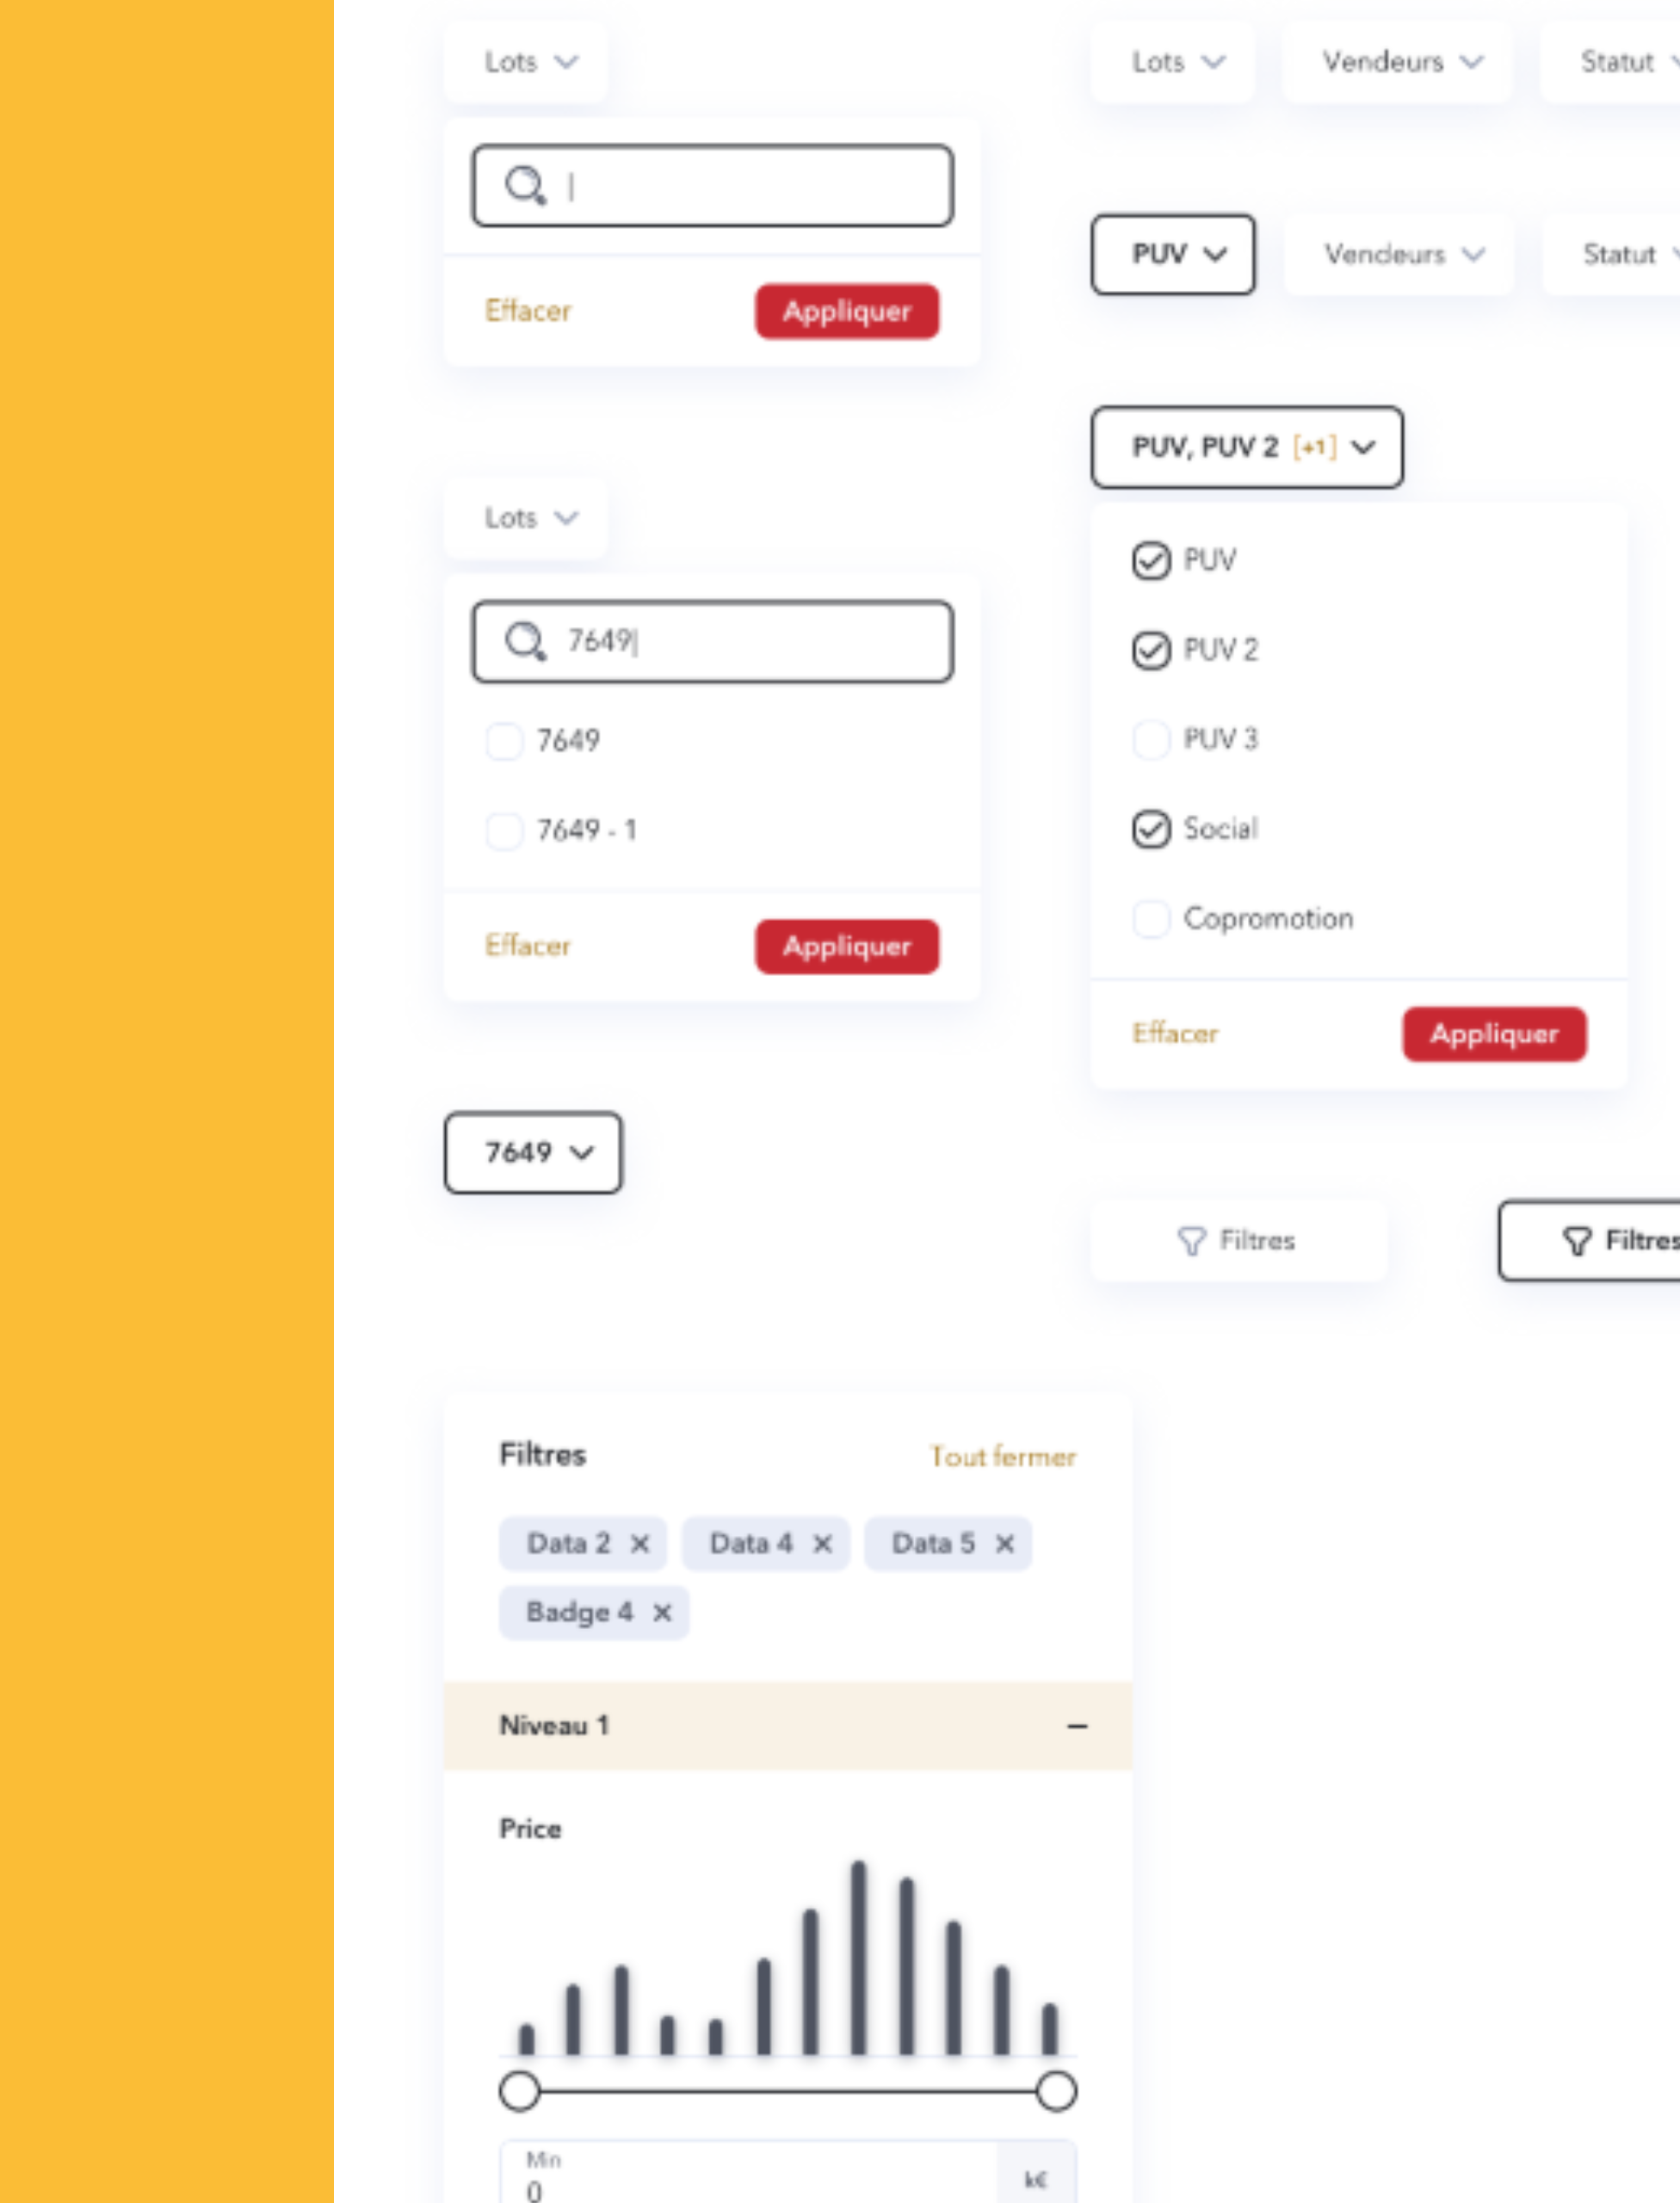
L'UI Kit assure une cohérence graphique pour tous les outils de Nexity, permettant aux designers de réutiliser des composants basiques. Les couleurs sont choisies pour garantir un contraste optimal et respecter les normes d'accessibilité, avec le rouge utilisé avec parcimonie et le doré réservé aux aplats.
UI Kit, Exemple de composant complexe pour le système de filtre
Bilan
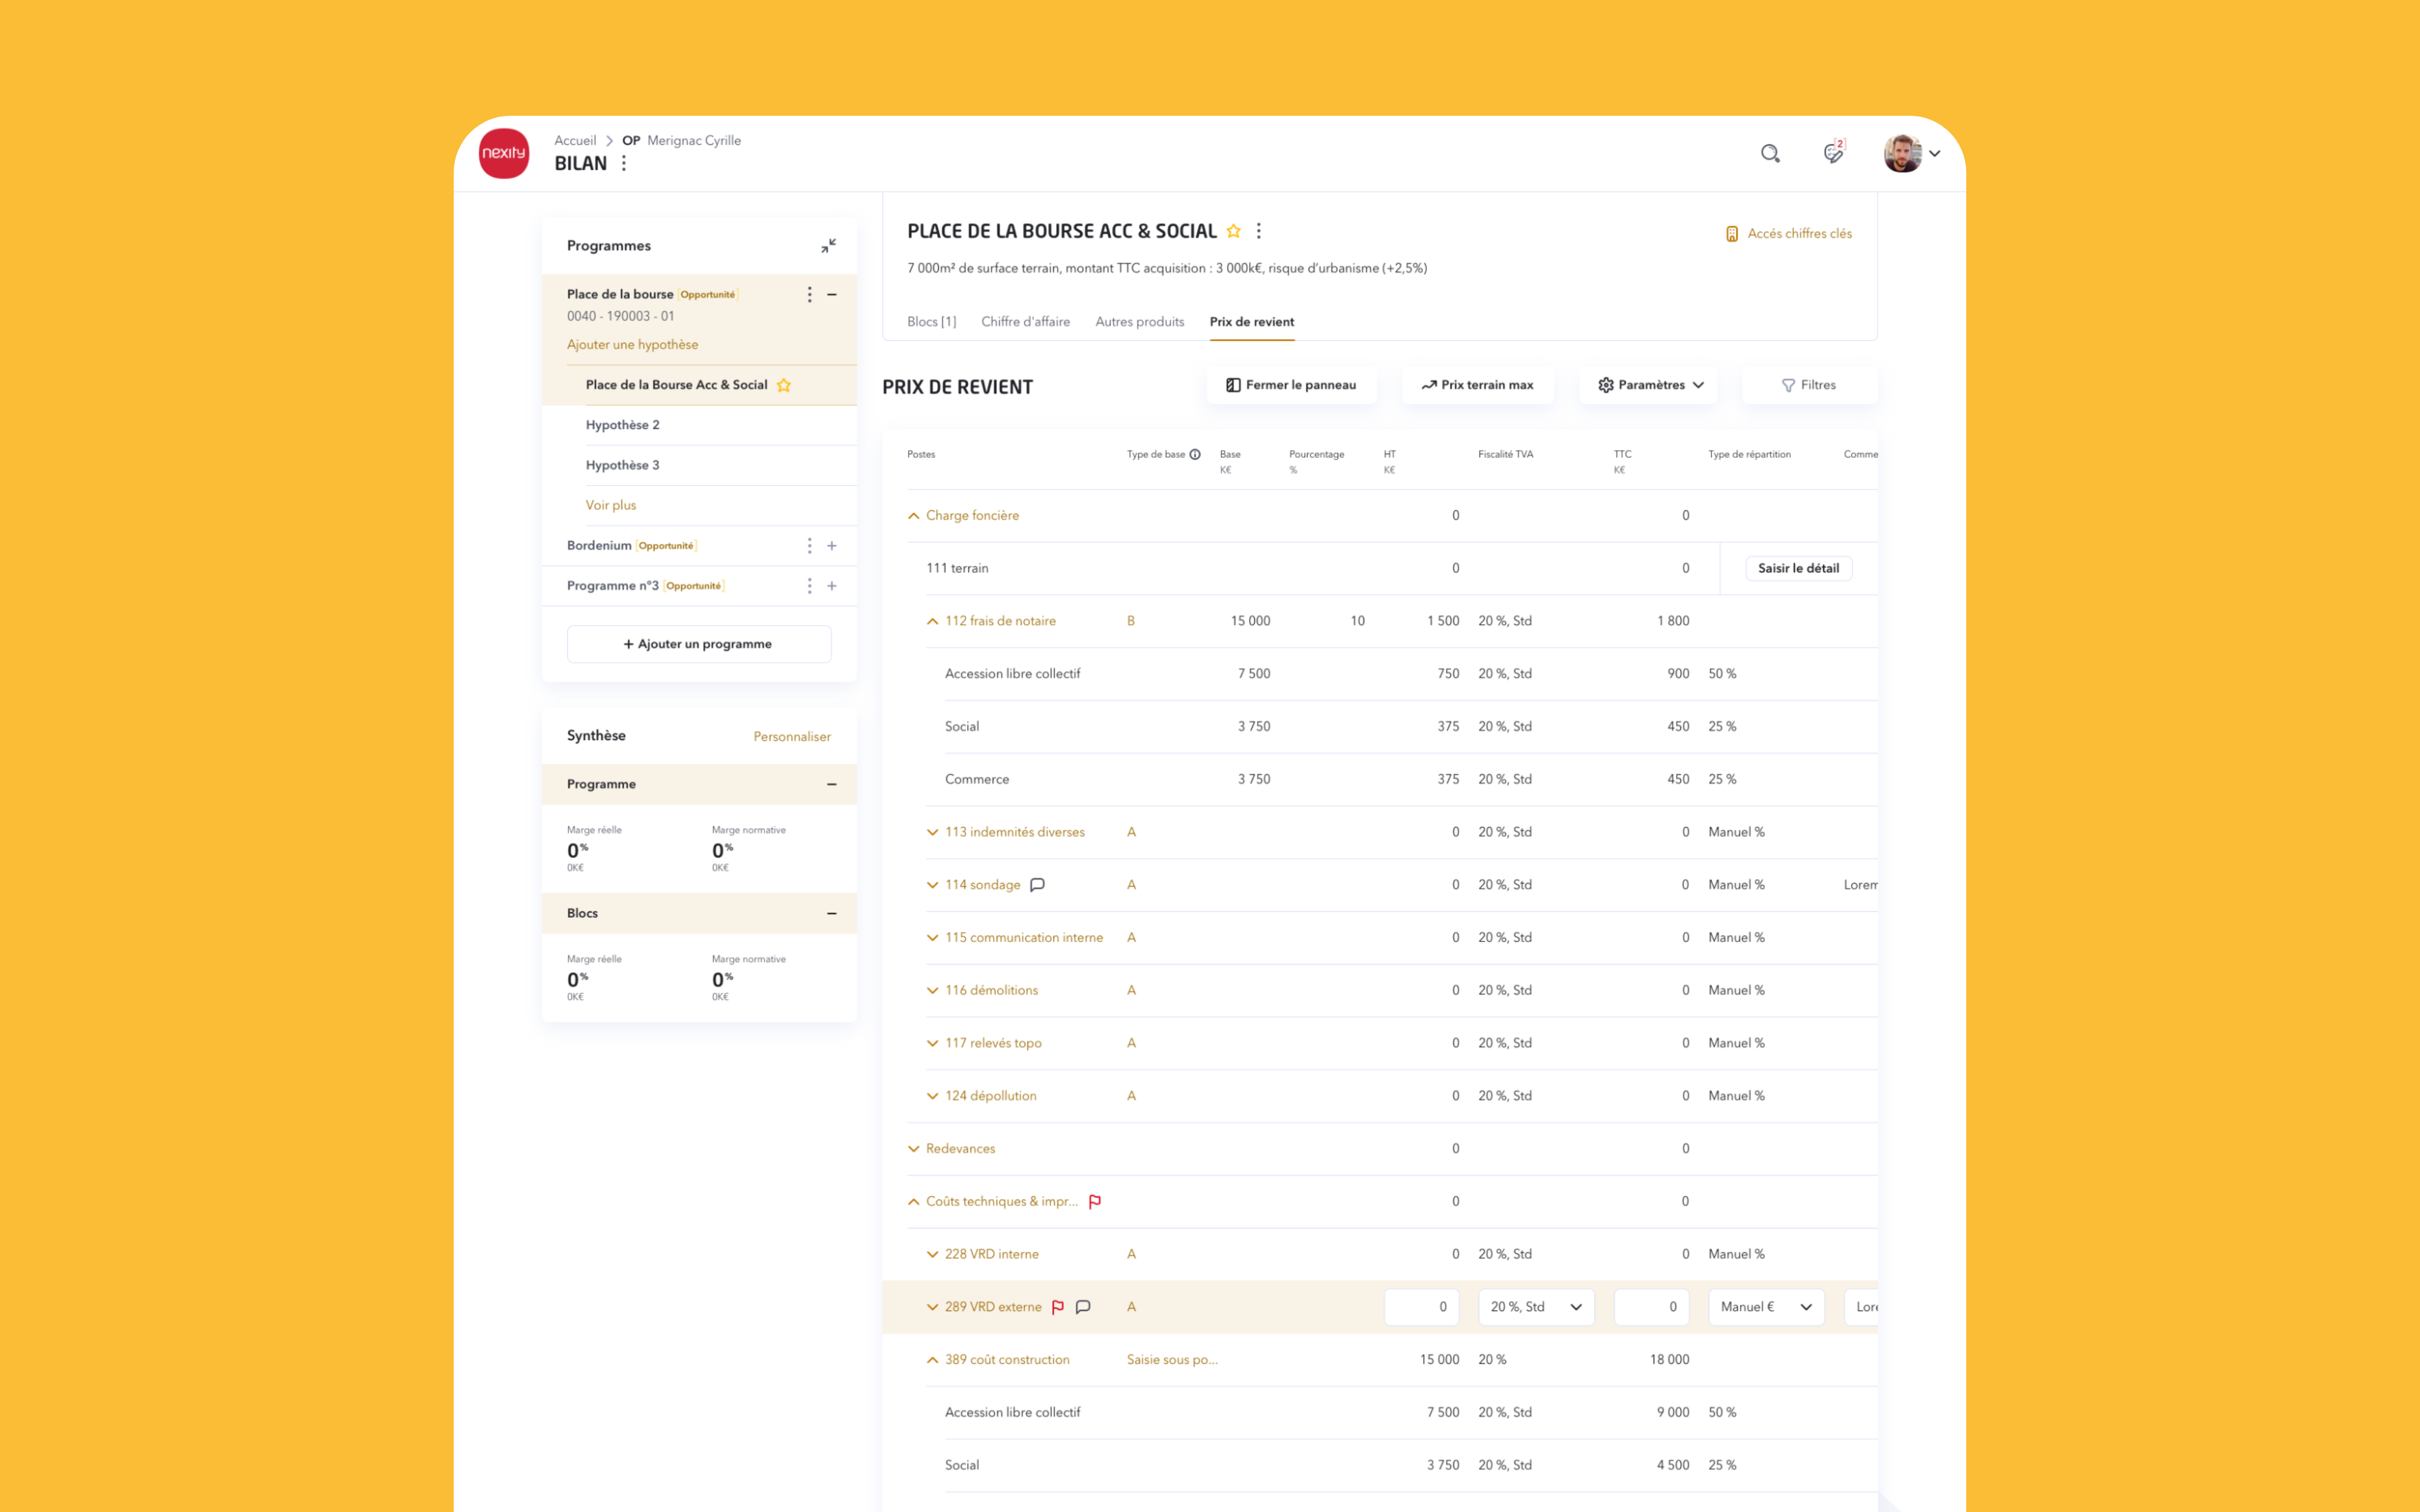
Le bilan est la pièce maîtresse de l'outil GPI, permettant aux utilisateurs de visualiser les données d'un seul coup d'œil. Un tableau a été conçu avec une option de visionnage en plein écran, et la navigation complexe a été simplifiée pour éviter la surcharge de la page.
Bilan, Vue d'ensemble de la page
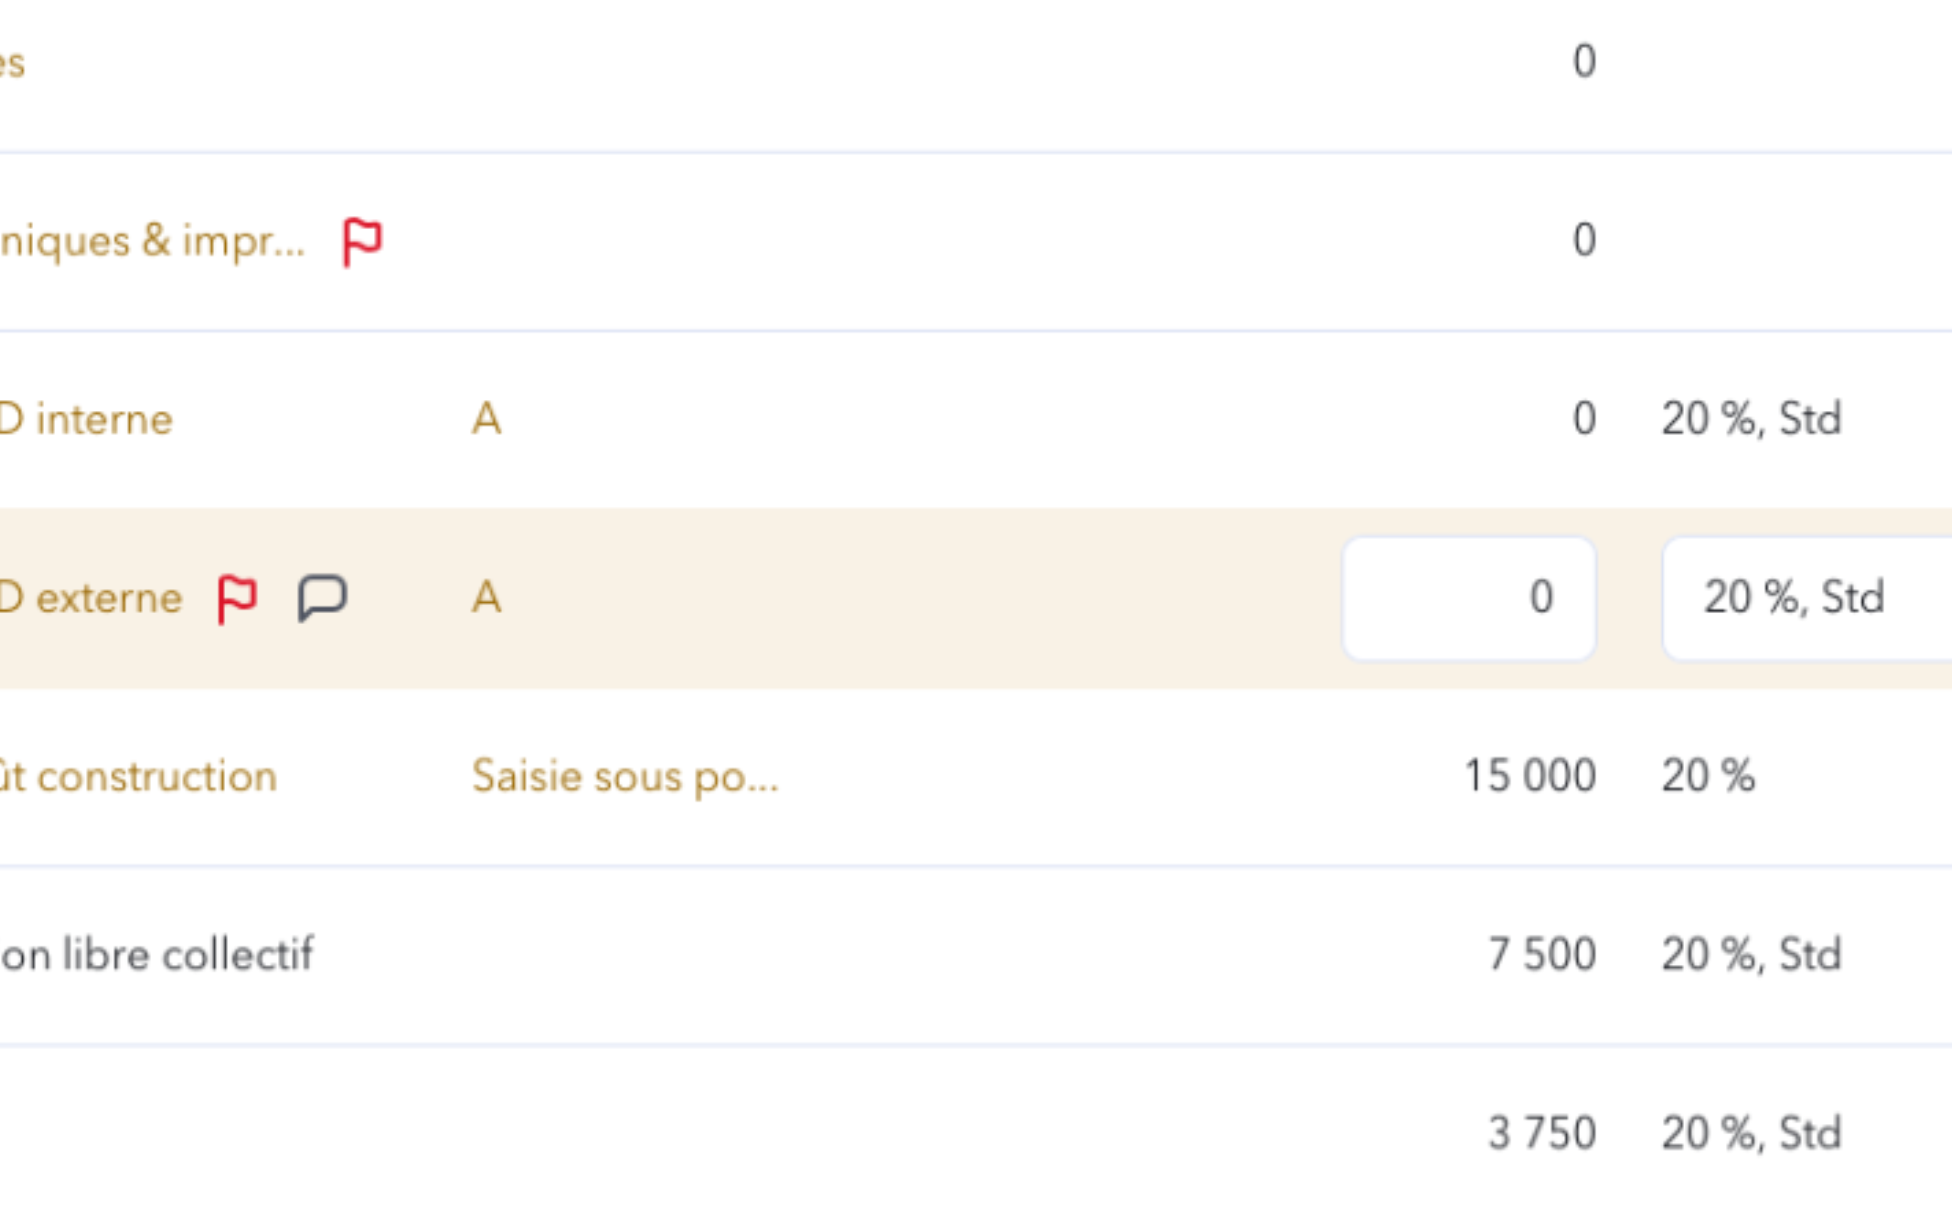
Nous avons construit un tableau avec la possibilité de le visionner en plein écran. La navigation complexe a été découpée pour ne pas surcharger la page. Nous avons également choisi de proposer la modification des données du tableau au survol afin d’alourdir la page. L’espacement entre les colonnes a été réduit au maximum pour éviter le scroll vertical.
Bilan, Modification des données au survol
Édition des données
Les écrans de modification reprennent la même structure afin d’apporter de la cohérence à l’utilisateur. Nous avons choisi de mettre les champs les uns en dessous des autres pour éviter la surcharge mentale de l’utilisateur. La navigation avec les ancres permet de palier à la longueur de la page.
Centralize the real estate properties under one roof
The Property Management Tool (GPI) facilitates the buying and selling of land by centralizing all information, from the area of the land to the construction of lots. This solution enables effective management of real estate projects, providing a comprehensive overview for informed decision-making.
#User Interface
#User Experience
#Prototyping
#Illustration
#Design System
GPI, Homepage
Work has been undertaken to improve working conditions and centralize information within a single tool. Existing tools did not satisfy users due to a cumbersome and unsuitable interface. As a result, Nexity employees have resorted to Excel as a temporary solution, complicating data sharing and collection, thus making management inefficient.
Dashboard
The dashboard consolidates all relevant information for the user, displaying the project address, financial figures, the number of programs, and land data. Its layout highlights key information, including the balance sheet and the number of associated programs, thus facilitating rapid and informed decision-making.
Dashboard, Presentation of all information about the land
UI Kit
The UI Kit ensures graphic consistency for all of Nexity's tools, allowing designers to reuse basic components. The colors are selected to guarantee optimal contrast and adhere to accessibility standards, with red used sparingly and gold reserved for flat areas.
UI Kit, Example of a complex component for the filter system
Financial balance
The financial balance is the centerpiece of the GPI tool, allowing users to visualize data at a glance. A table has been designed with a full-screen viewing option, and complex navigation has been simplified to prevent page overload.
Financial balance, Overview of the page
We built a table with the option for full-screen viewing. Complex navigation has been segmented to prevent page clutter. We also opted to allow data modification in the table on hover to keep the page lightweight. The spacing between columns has been minimized to avoid vertical scrolling.
Financial balance, Data modification on hover
Data edition
The modification screens follow the same structure to provide consistency for the user. We chose to stack the fields vertically to reduce the user's cognitive load. Navigation using anchors helps to address the length of the page.